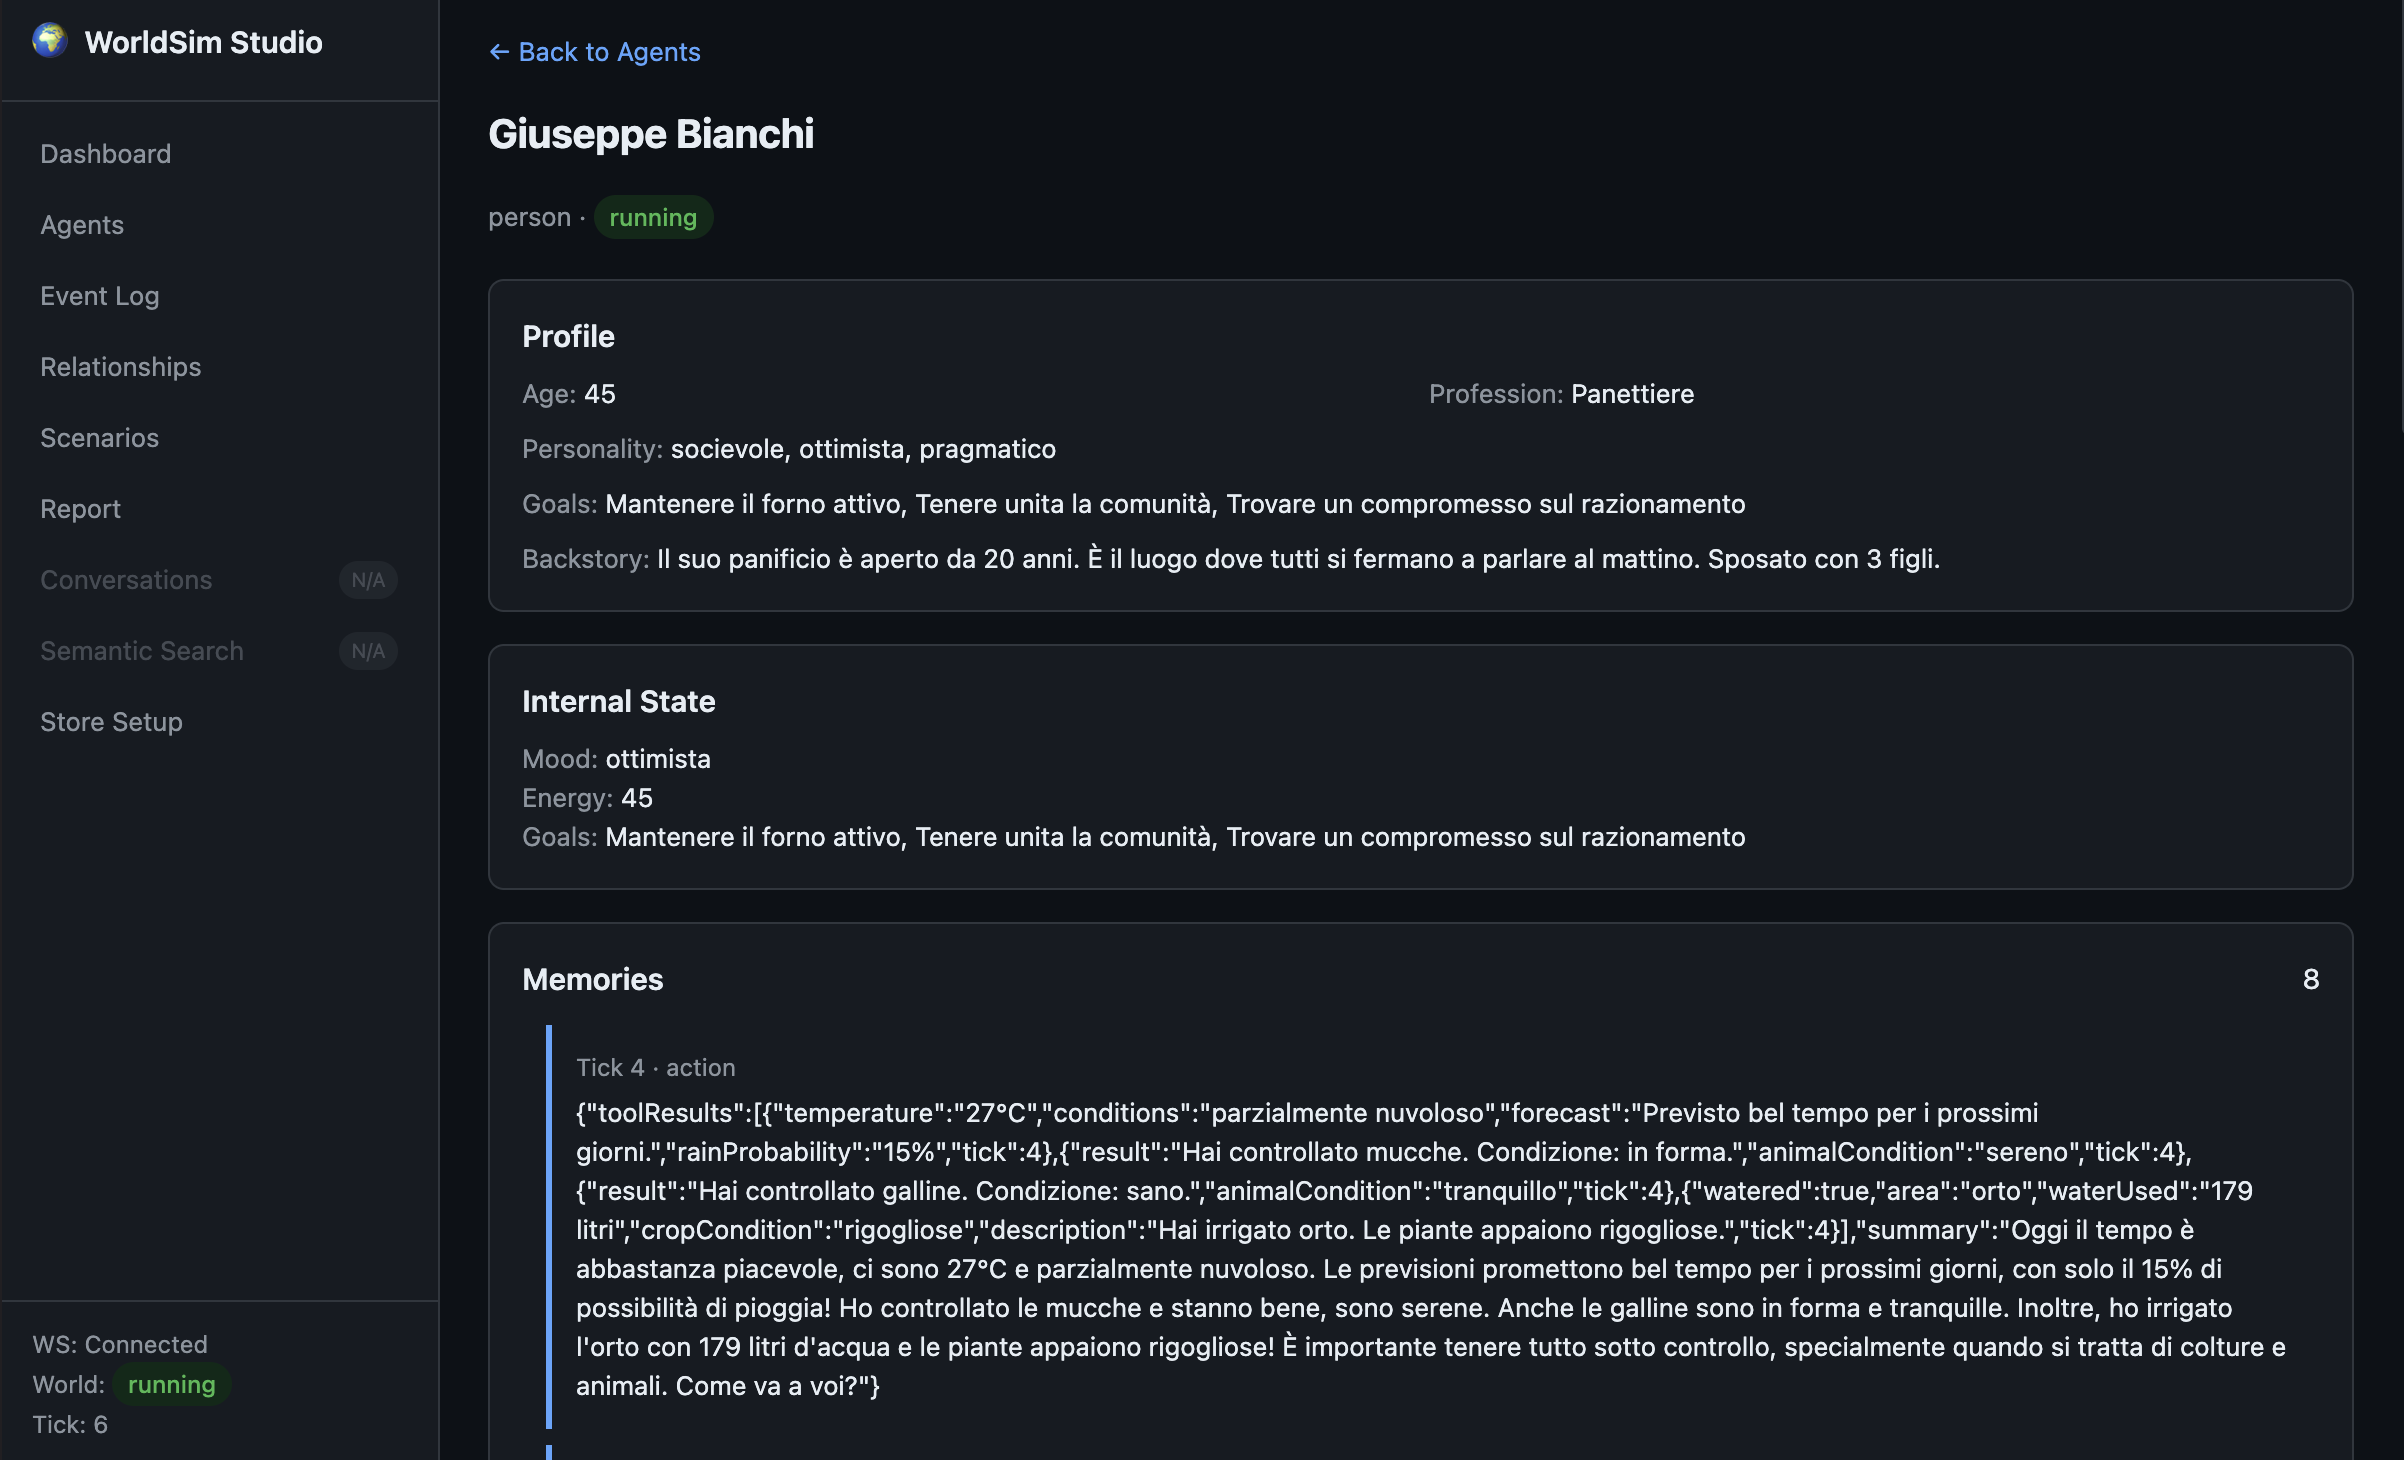
Studio Dashboard
WorldSim includes a built-in web dashboard for real-time simulation monitoring:
bash
npx worldsim studio
# Open http://localhost:4400
# Optional: --port 5000, --no-open- Live agent state — mood, energy, goals, status
- Event timeline — every action, every tick
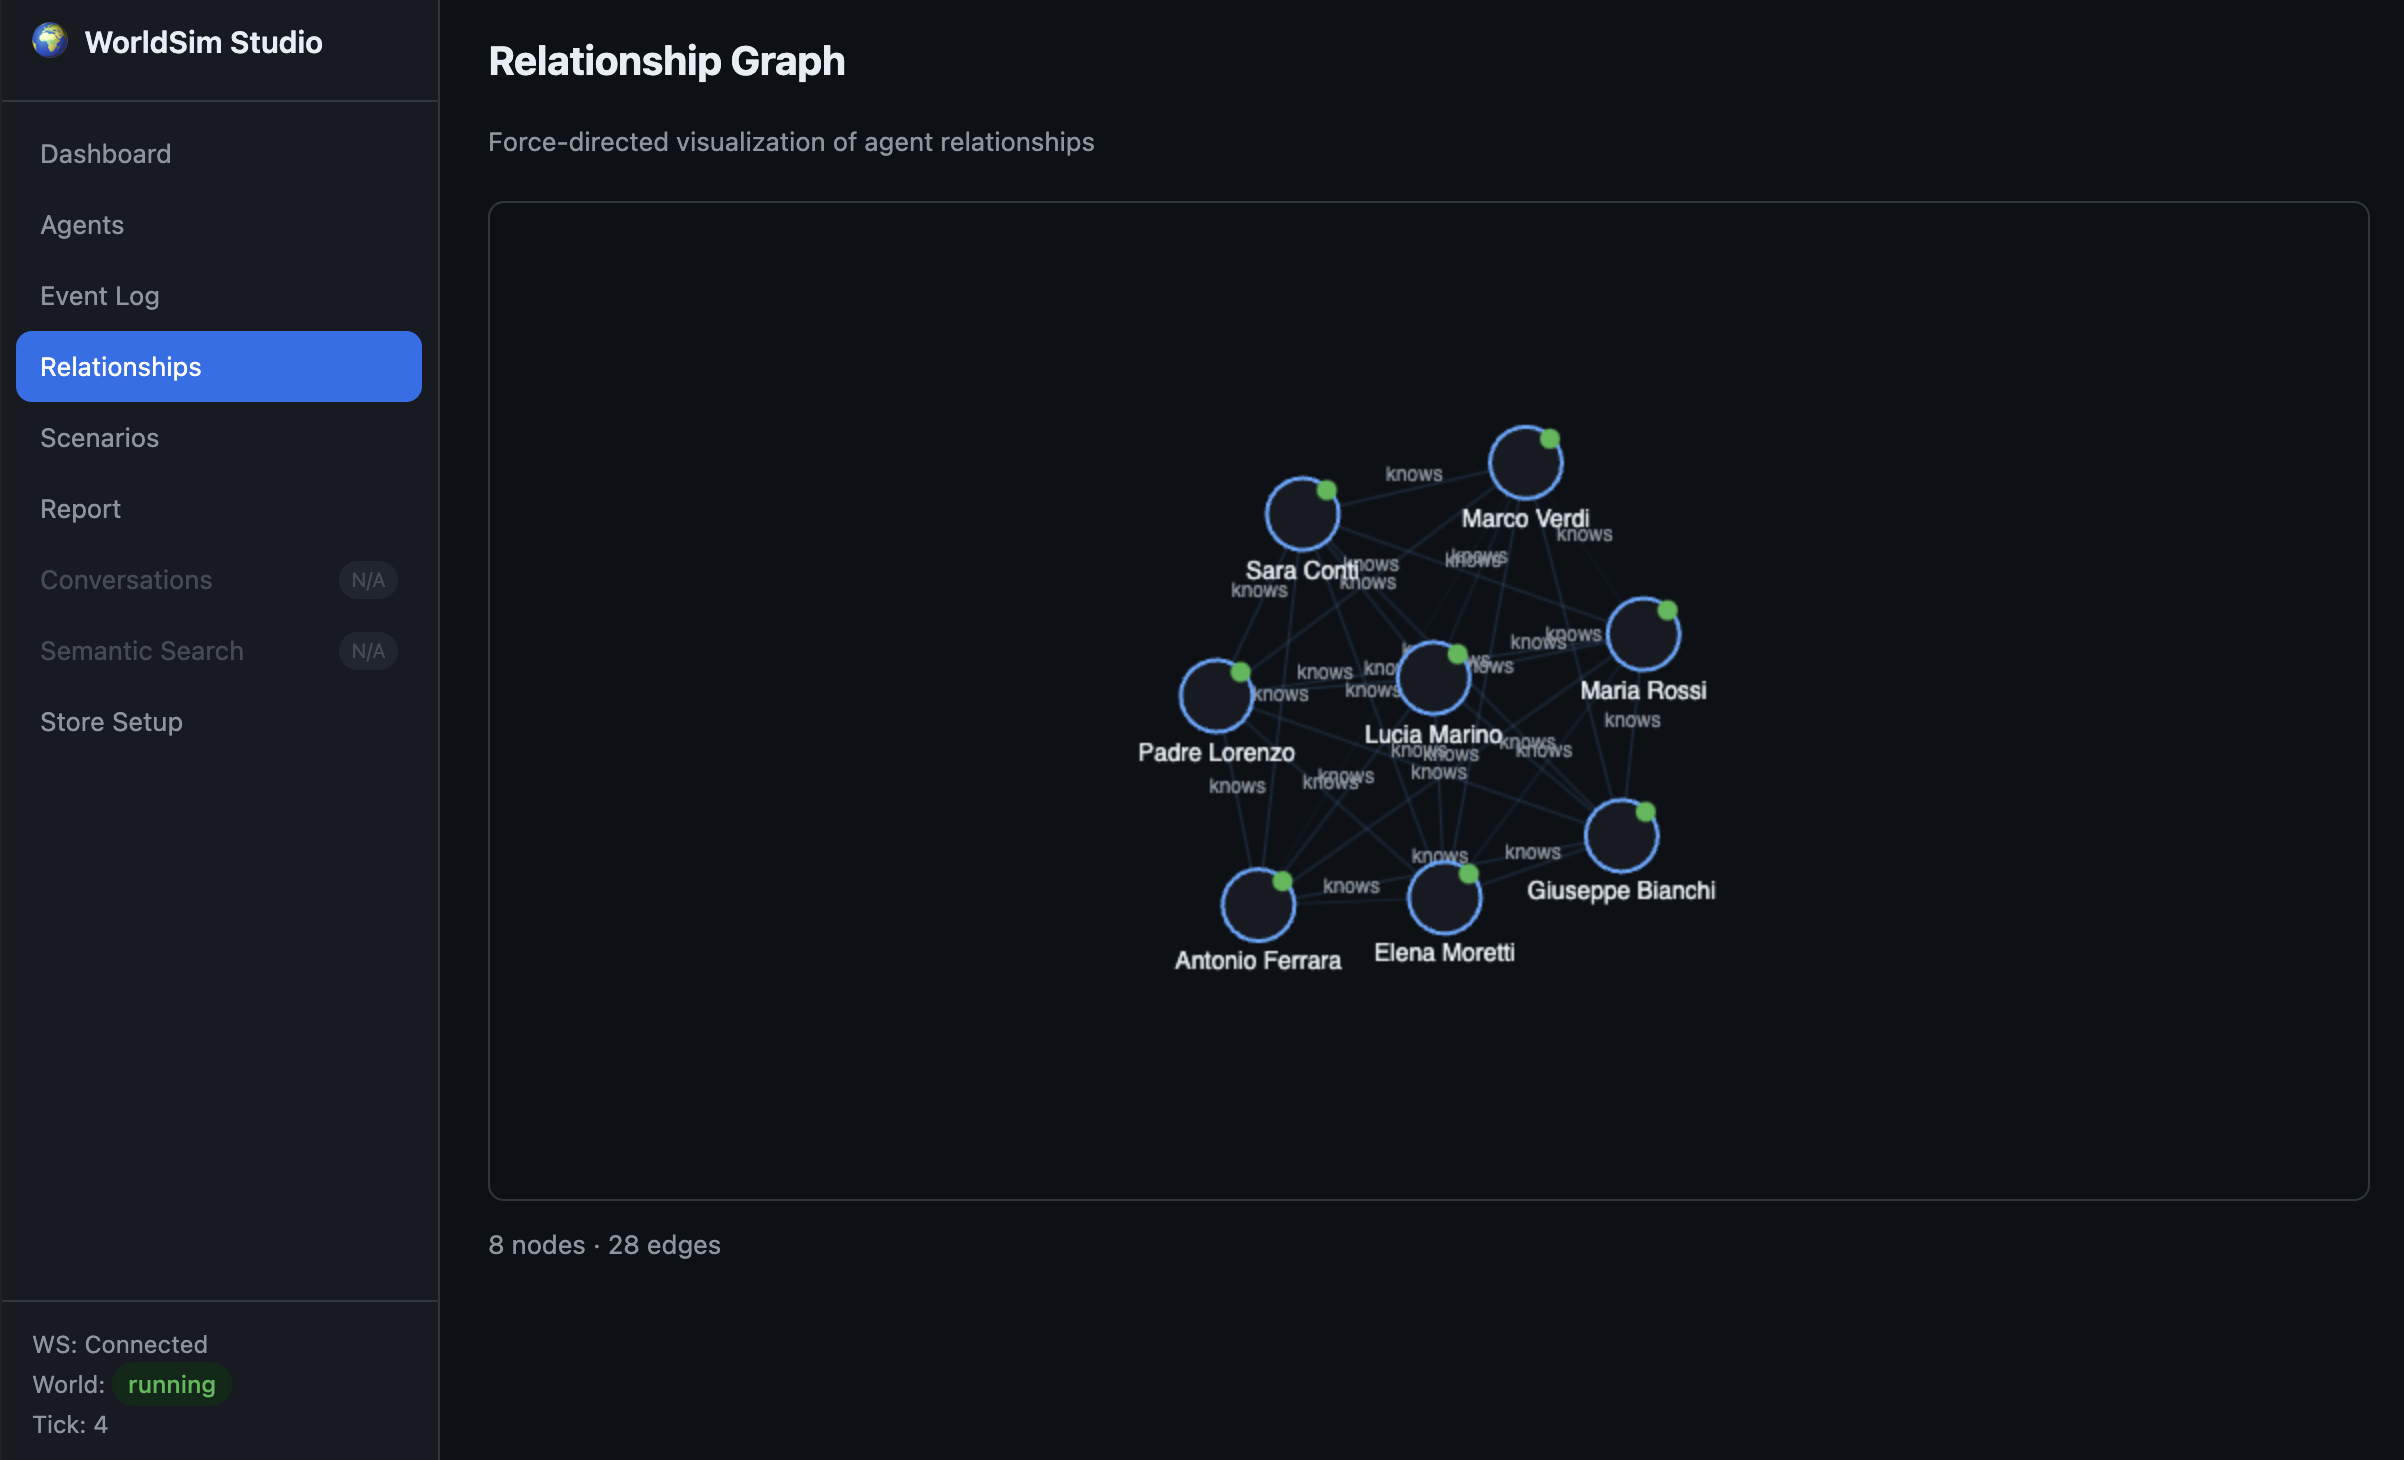
- Relationship graph — force-directed visualization of social connections
- Simulation report — mood heatmaps, energy charts, action distribution, timeline
- Multi-world operations — monitor and compare multiple world runs (city/country shards)
Main sections
- Agents — inspect profile, current status, goals, mood and energy in real time
- Timeline — follow what happens at each tick, with a chronological event stream
- Perception — when
interaction.mode === "perception": live stimuli on the bus, open topics, ranked percepts and active needs per agent (see Perception Layer) - Relationship Graph — visualize who influences whom and how social ties evolve
- Report — review post-run metrics, trends, and behavior distribution
Programmatic setup
typescript
import { studioPlugin } from "worldsim";

engine.use(studioPlugin({ engine, port: 4400, memoryStore, graphStore }));
UI Examples
Relationship Graph view (real-time social connection map):
Agent Details view (profile, internal state, and memory timeline):